
BÀI MẪU IELTS WRITING TASK 1 – BAR CHART
QUESTION:
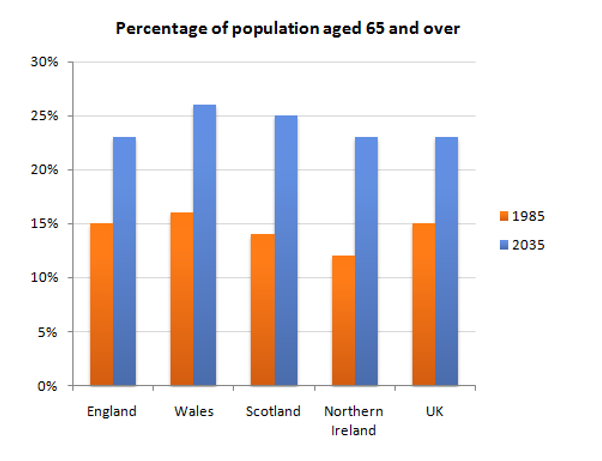
The chart below gives information about the UK's ageing population in 1985 and makes predictions for 2035.
Summarise the information by selecting and reporting the main features, and make comparisons where relevant.
You should spend about 20 minutes on this task.
Write at least 150 words.
MS TRANG’S MODEL:
The bar chart above illustrates the percentage of the UK’s aging population in 1985 and some expectations for the later 50 years.
Overall, the proportions of 65-year old people are estimated to rise in all five countries. Wales has been the highest percentage in both two periods while the lowest one has belonged to Northern Ireland.
As can be seen from the chart, Wales reached a peak of 16% in the proportion of over 65s in 1985 which was 1% higher than England and the UK at 15% for each. The third largest group was Scotland about 14% while the lowest was Northern Ireland at nearly 13%.
In 2035, all nations are predicted to increase dramatically in the percentage of old people aging 65 and over. Wales is going to dominate the top position by the figure is likely to go up to 26 per cent. However, a forecast of the biggest increases is possible to belong to Scotland and Northern Ireland where the figures of the elderly can be rocketed doubly to 25% and 23% respectively. The percentage of 65 over people is also getting 23% in England and the UK in 2035.
(194 words)
MS TRANG, AN IELTS 6-YEAR TEACHER, FROM ENGLISH EUROLINK CENTER,
VOCABULARY MATERIALS
1. Expectations = predictions = forecast (noun): sự dự đoán
2. The later 50 years (noun): 50 năm sau
3. Proportion = percentage = figure (noun): phần trăm/ số liệu
4. Reached a peak of (verb): đạt đỉnh cao
5. Dominate the top position (phrase): thống trị vị trí dẫn đầu
6. Rocketed doubly (phrase): tăng vọt gấp đôi
Trở về